By Joe Garland
From November 2020 through July 2021, over 8.6 million voters were purged from official registration lists nationwide.[1] Voter purges occur for a variety of reasons – elections officials are required by the National Voter Registration Act[2] to continuously maintain their voter registration lists by removing the names of voters who move or die, and state and local elections officials often go beyond this requirement to remove voters who are incarcerated, who have failed to vote in recent elections, and who have failed to confirm their address with elections officials, among other reasons.
There is no standard process for states maintaining their voting rolls, creating an unpredictable patchwork of local and state regulations that often disenfranchise marginalized communities and communities of color. Racial discrepancies among purged voters have long been a subject of scrutiny among civil rights advocacy organizations, and legal[3] actions[4] nationwide[5] have exposed systematic bias against communities of color by state and local elections officials.
Using VoterBase, TargetSmart’s industry-leading national voter file, our team has investigated patterns among purged voter registrations from the 2020 general election through the first half of 2021. We are able to examine not just how many voters have been purged, but look deeper at their age, race, partisanship[6], voting history, education and more to paint a fuller picture of the impact of these purges.
Our analysis found significant localized racial discrepancies among purged voters at the county level across multiple states.
Data
In total, 4.7% of all records[7] present in VoterBase on November 3, 2020, were no longer present on the file by July 27, 2021. On the whole, this would suggest the absence of a national bias toward purging people of color from voter rolls.
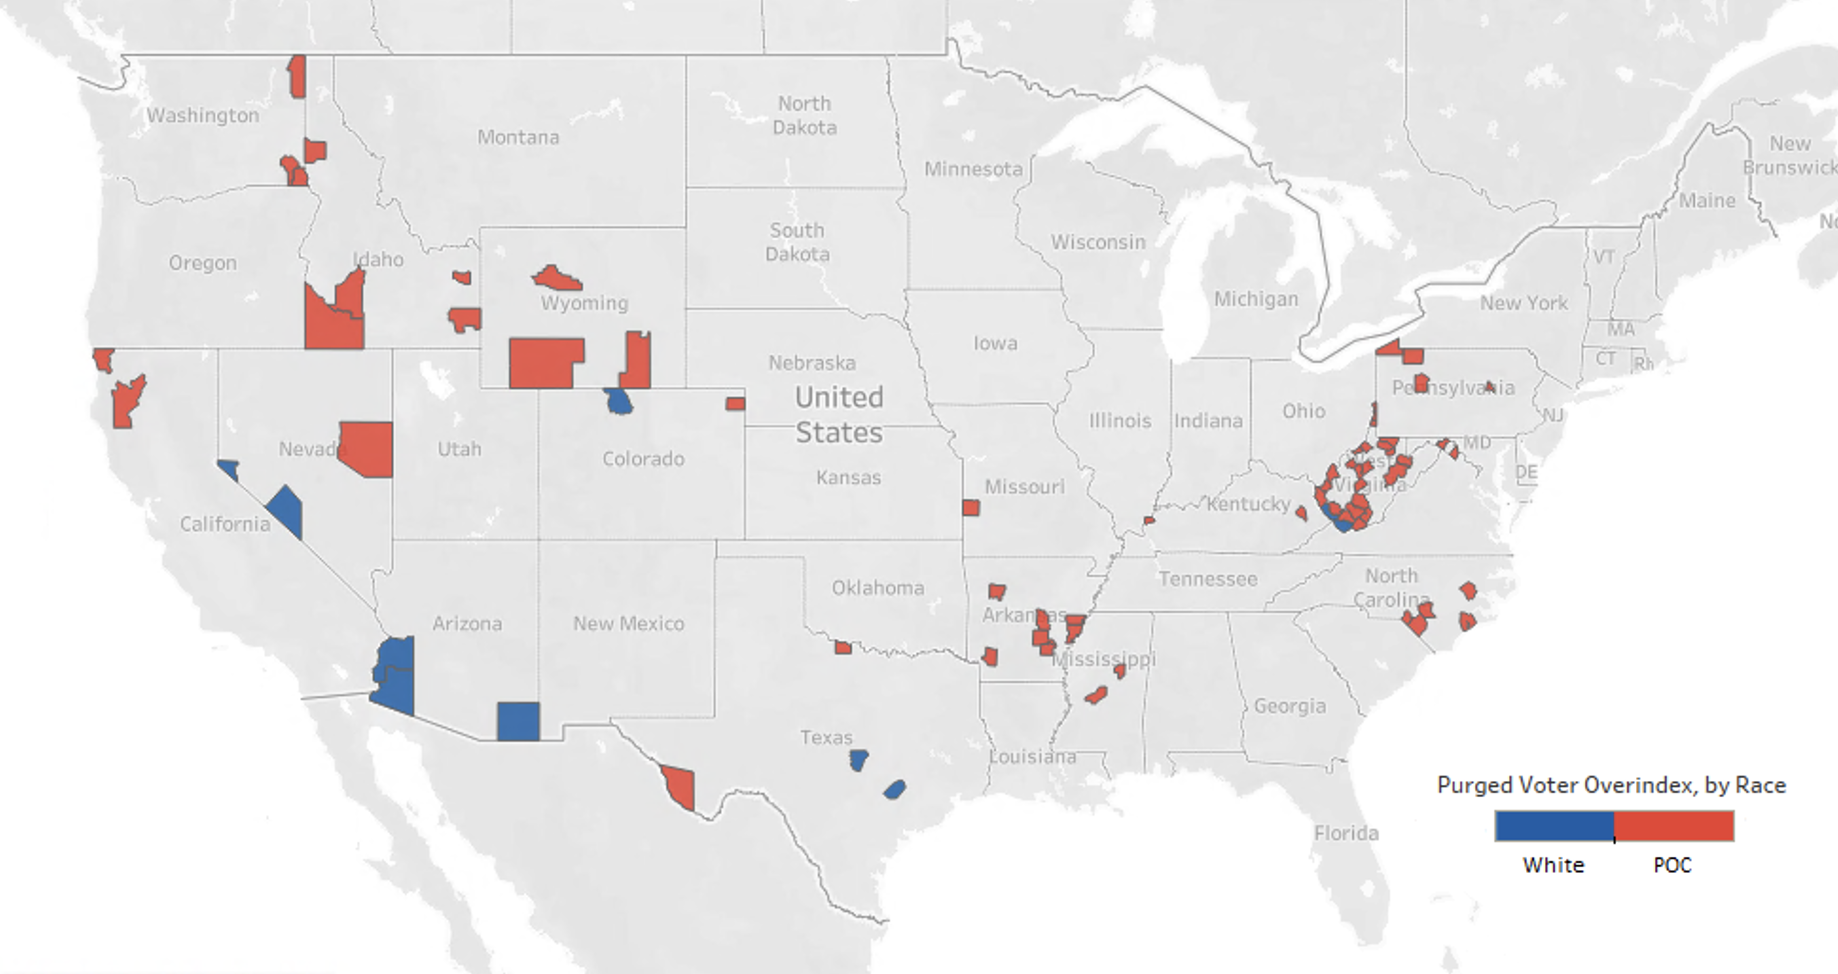
However, within this abridged[8] national file, we found 73 counties where greater than 11%[9] of registered voters present on the Election Day 2020 file were purged by late July. These 73 counties were the most aggressive at purging voters in the first half of 2021, comprising the top 2.5% of counties nationwide. Of these 73 counties, 63 of them disproportionately purged people of color in the months following the 2020 general election.
Figure 1: Counties where greater than 11% of the voter file was purged between November 2020 and July 2021, coded by racial discrepancy
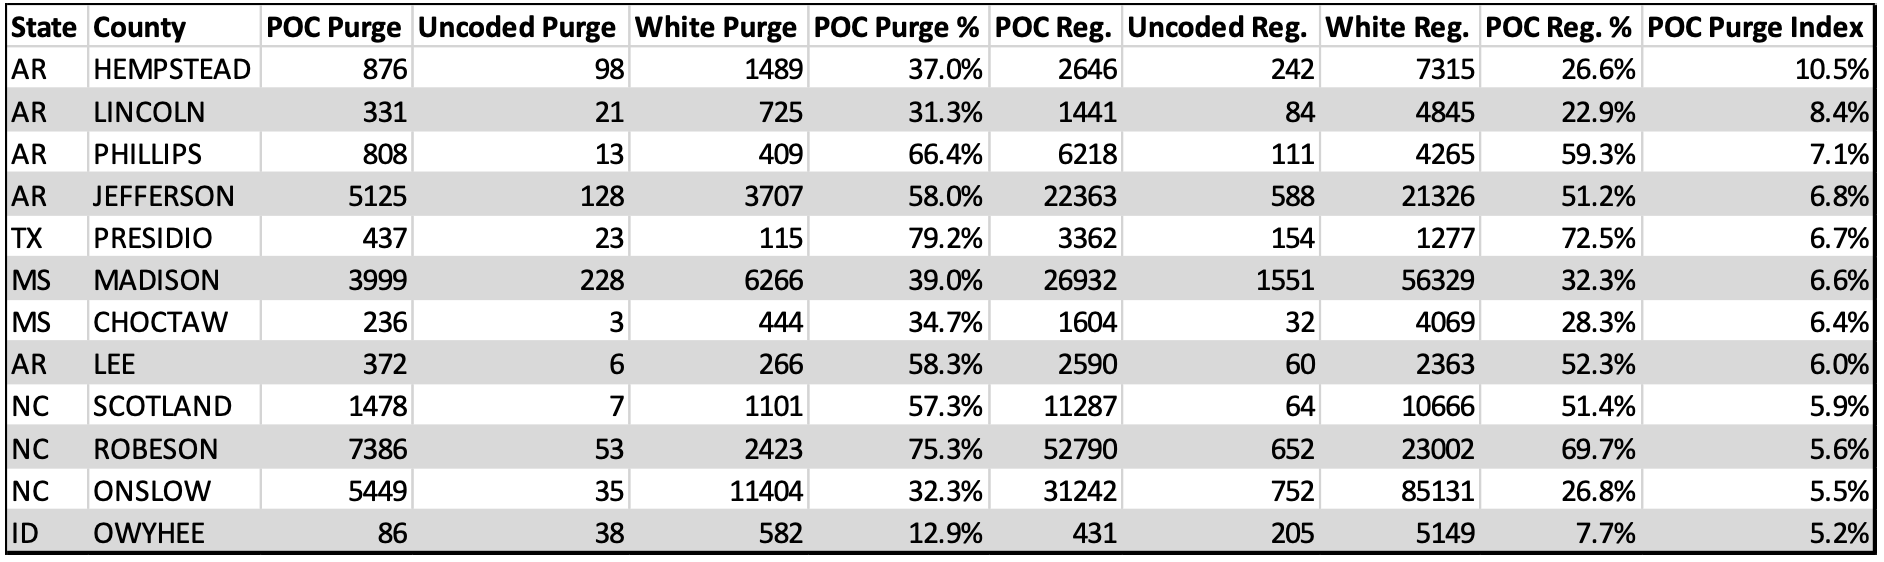
In the 63 aggressively purging counties where people of color were purged at a higher rate than their overall registration shares, our data shows the heaviest disproportionalities among four counties in Arkansas:
- Hempstead County, where 37% of purged voters were POC, versus 26% of all registered voters
- Lincoln County, where 31% of purged voters were POC, versus 23% of all registered voters
- Phillips County, where 66% of purged voters were POC, versus 59% of all registered voters
- Jefferson County, where 58% of purged voters were POC, versus 51% of all registered voters
Figure 2: Counties where voter purges disproportionately impact people of color by more than 5%
In the ten counties where white voters were purged at a higher rate than their overall registration shares, the heaviest disproportionality appears in Yuma County, AZ, with whites comprising 63% of purged voters and 49% of the registered population.
Figure 3: Counties where voter purges disproportionately impact whites by more than 5%
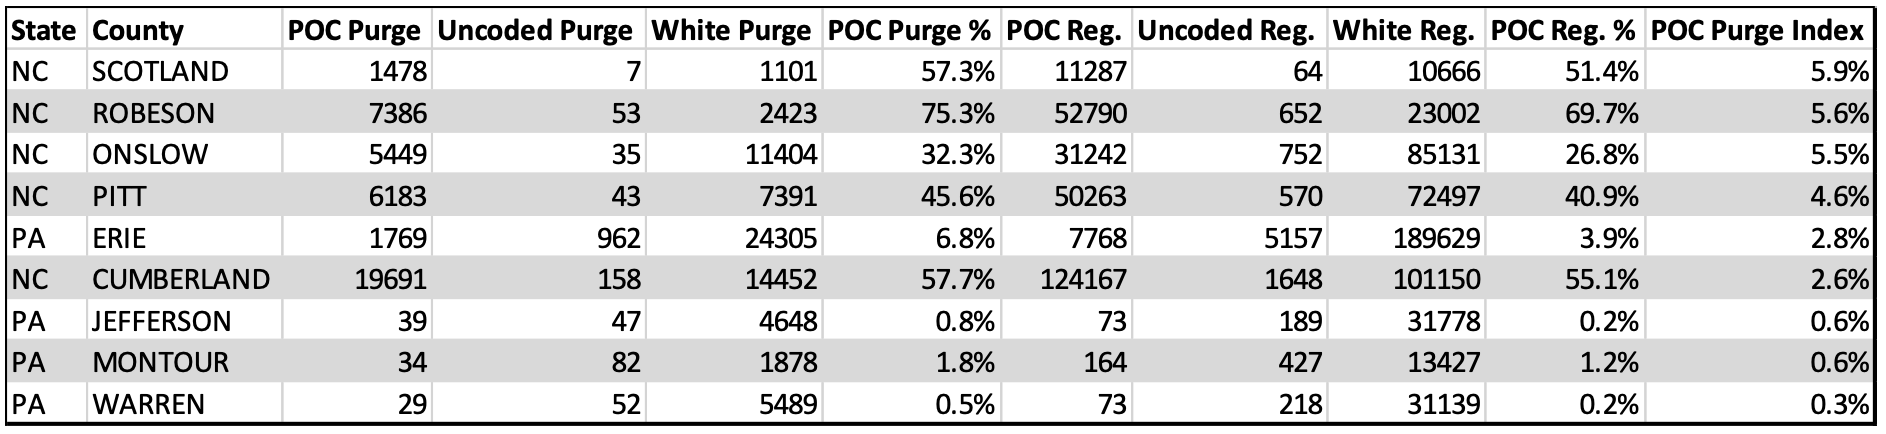
 Likely competitive races for open senate seats in North Carolina and Pennsylvania in 2022 warrant a highlight of purge disproportionalities in these states. In North Carolina, among counties where overall purge shares exceed 11%, five counties in the eastern half of the state show racial disproportionalities in voter purges – all of them skewed toward disproportionally purging POC voters:
- Scotland County, where 57% of purged voters were POC, versus 51% of all registered voters
- Robeson County, where 75% of purged voters were POC, versus 70% of all registered voters
- Onslow County, where 32% of purged voters were POC, versus 27% of all registered voters
- Pitt County, where 46% of purged voters were POC, versus 41% of all registered voters
- Cumberland County, where 58% of purged voters were POC, versus 55% of all registered voters
Notable disproportionalities emerge among four counties in western Pennsylvania, particularly in counties with large white voter registration majorities:
- Erie County, where 7% of purged voters were POC, versus 4% of all registered voters
- Jefferson County, where 0.8% of purged voters were POC, versus 0.2% of all registered voters, and where 53% of all POC voters (39 of 73) were purged from the file
- Montour County, where 1.8% of purged voters were POC, versus 1.2% of all registered voters, and where 21% of all POC voters (34 of 164) were purged from the file
- Warren County, where 0.5% of purged voters were POC, versus 0.2% of all registered voters, and where 40% of all POC voters (29 of 73) were purged from the file
Among the 73 most aggressively purging counties nationwide, the two most populous counties where people of color were disproportionately purged were in these two states – Cumberland County, NC and Erie County, PA.
Figure 4: County-level purges in North Carolina and Pennsylvania
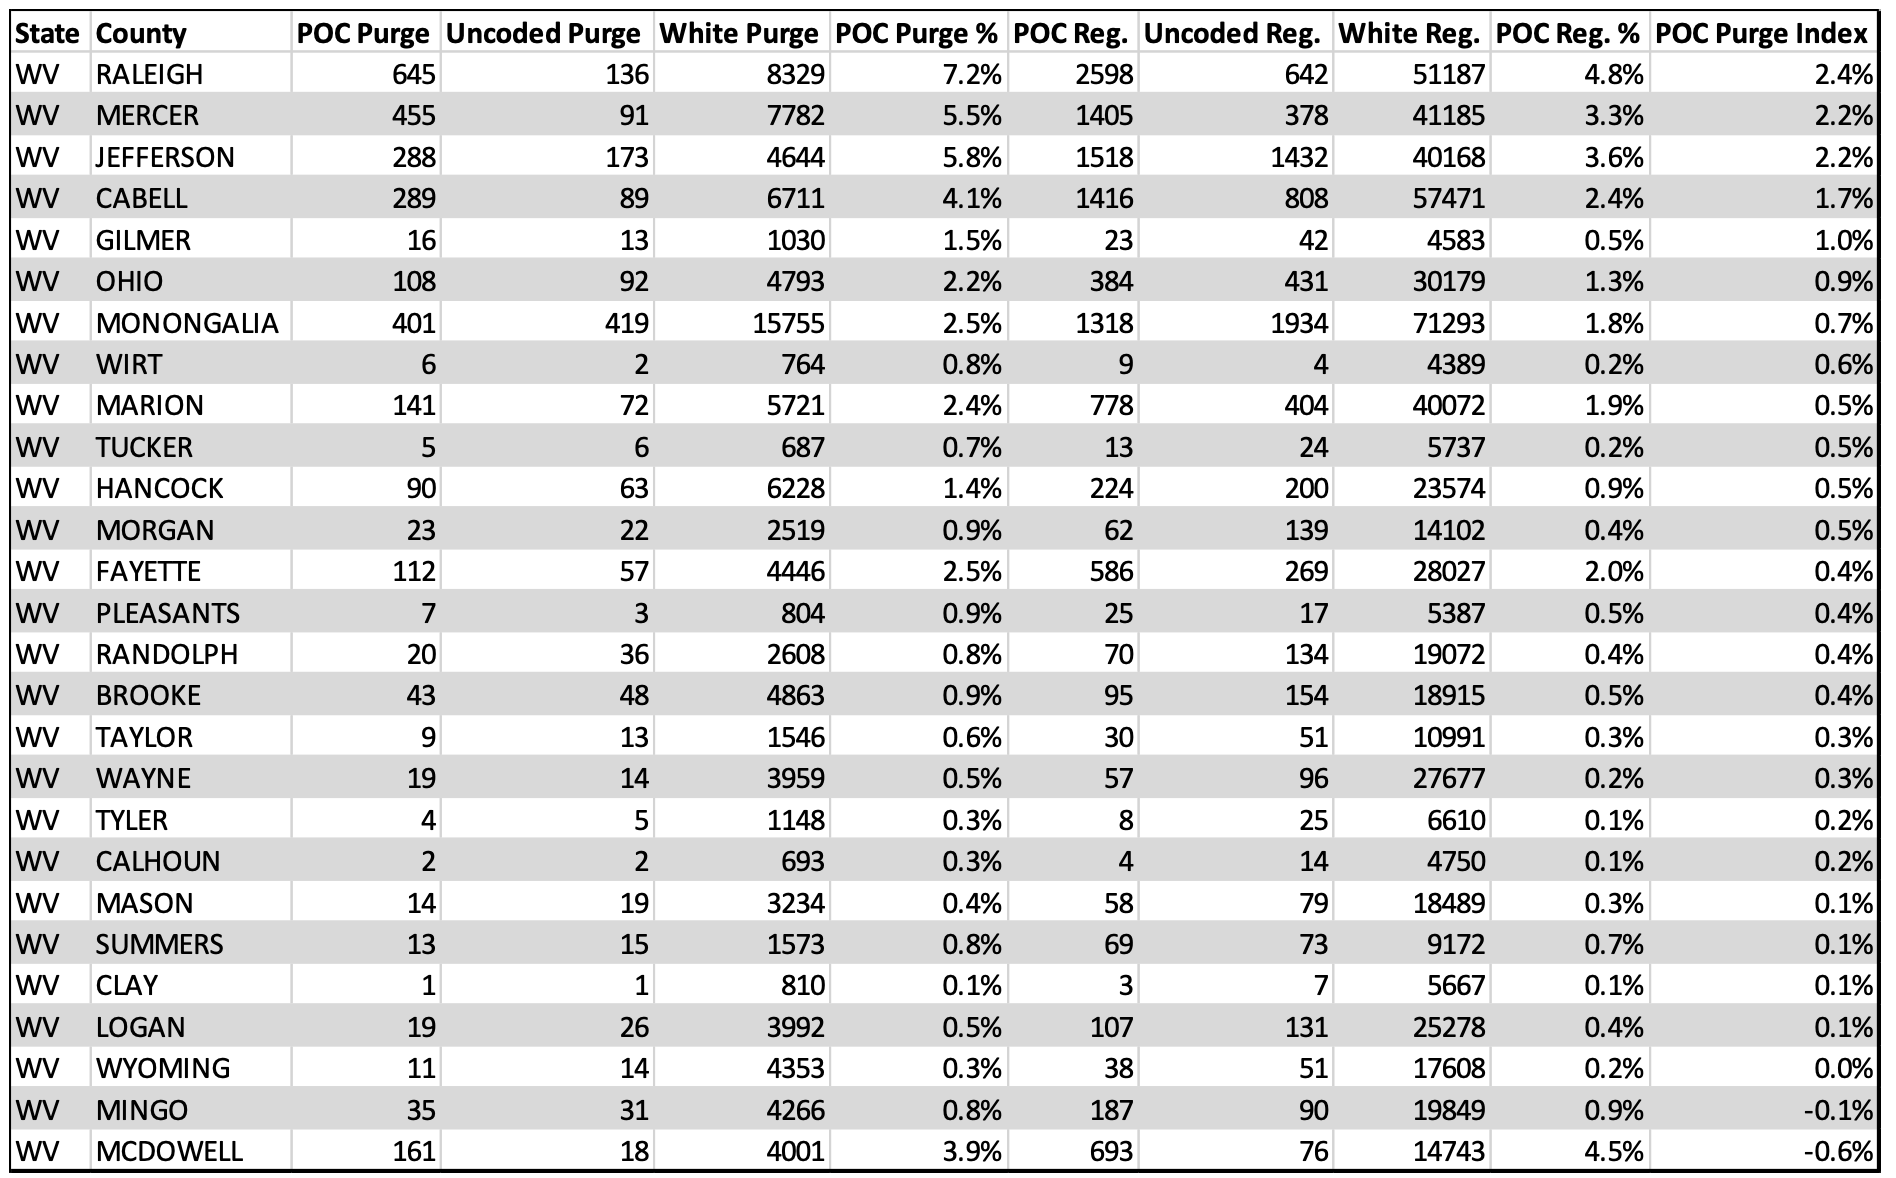
 Another item of note from the national data emerges in West Virginia, where 27 counties purged greater than 11% of their voter rolls in the months following the 2020 general election. Three of these counties (Raleigh, Mercer, and Jefferson) showed racial discrepancies exceeding 2%, each skewing toward disproportionally purging POC voters. In total, while many of the skews are relatively small and occur among low population counts, a full 25 of the 27 most aggressively purging counties in West Virginia skew toward disproportionally purging POC voters.
Figure 5: County-level purges in West Virginia
 Implications
Racial disproportionalities among purged voters at the county level can appear for a multitude of reasons. Numbers like those we’ve highlighted above can be explained by voters of one race moving away from a county at higher rates than voters of other races, or higher death rates emerging among voters of a single race. Systems of government can affect these numbers as well. For example, it is possible for New England counties to show high rates of racial disproportionality among purged voters because elections there are administered at the city and town level. If towns with a high concentration of POC report annual purges faster than towns with high concentrations of white voters, it can give the appearance of countywide purge bias toward POC voters when in fact what we see is simply an artifact of variability in municipal management. For these reasons, we are careful to refer to these imbalances as disproportionalities rather than biases.
That said, this data can provide valuable evidence to voting rights advocates across the country, who may have been witnessing and fighting against patterns of discrimination at the local level without access to the hard numbers to back their suspicions up. While many of the counties we highlight may have valid explanations for their discrepancies, it is possible that some may not. Our goal is to begin the conversation by shining light on these patterns so that activists can dig further and paint a more complete story behind changes in the voter file.
[1] This analysis excludes Utah, where recently enacted opt-out privacy laws prevent apples-to-apples comparison of files across the specified time period, and North Dakota, which does not register voters.
[2] https://www.justice.gov/crt/national-voter-registration-act-1993-nvra
[3] https://www.naacpldf.org/news/ldf-submits-testimony-to-the-texas-house-elections-committee-opposing-s-b-1114/
[4] https://www.ajc.com/news/atlanta-news/dekalb-elections-board-votes-to-settle-lawsuit-pay-82500/VYYKFOWKMJDENI6VTOFGRBPQKE/
[5] https://www.aclu.org/press-releases/federal-appeals-court-upholds-block-indiana-voter-purge-law
[6] Modeled partisanship is used when partisan registration is unavailable through voter registration records.
[7] Excluding UT and ND.
[8] For this analysis, TargetSmart looked at a total of 2,820 counties, parishes, and statistically equivalent entities across the United States. This category includes the District of Columbia.
[9] The 11% figure represents two standard deviations above the national purged voter average.