Friends,
For more than a month we have been sharing updates here and on Twitter on how women are registering to vote in record numbers since the Supreme Court overturned Roe v. Wade. Now we’re proud to be releasing a first-of-its kind dashboard that gives you the most up-to-date voter registration data at your fingertips.
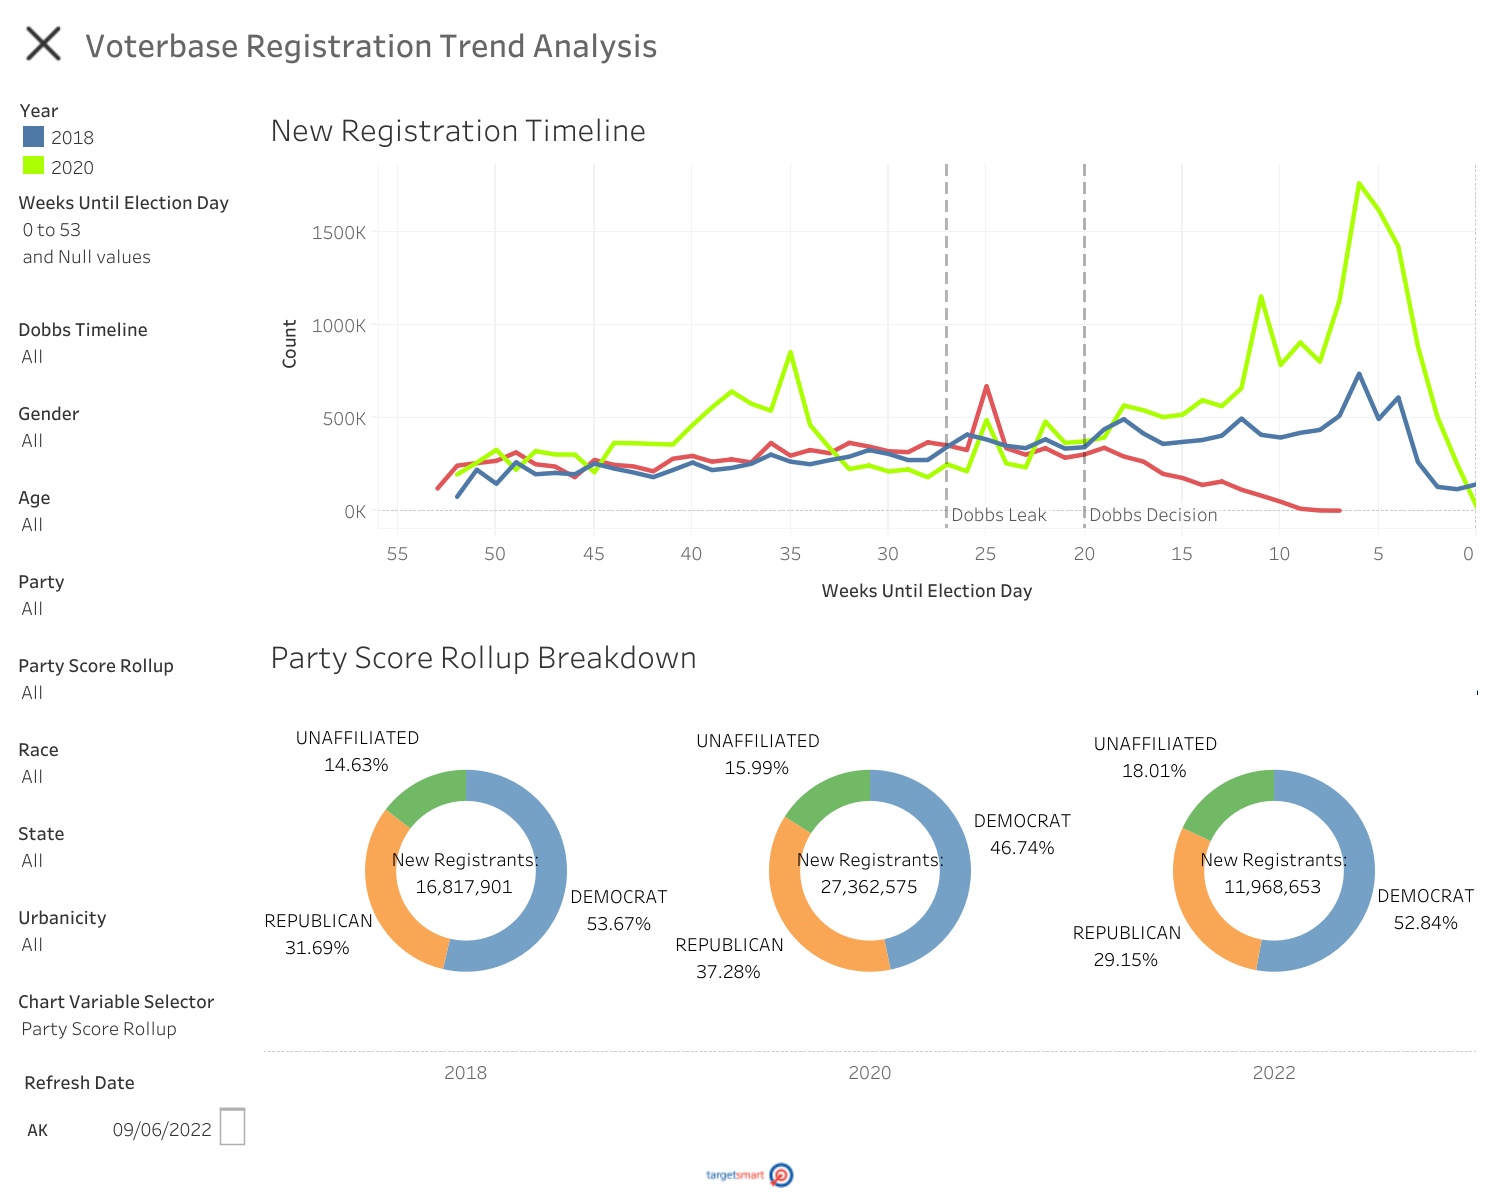
The TargetSmart Voter Registration Dashboard
- In August, we saw in Kansas that women accounted for an astounding 56% of all ballots cast defeated a Constitutional amendment to ban abortion.
- Since the Dobbs decision, we’ve seen women outpace men and Democrats outpace Republicans in registrations in key battleground states, including Pennsylvania (+8), Ohio (+6) , and Wisconsin (+8)
- We’ve also seen Democrats out-register Republicans since the decision in other key states including Nevada (+32), North Carolina (+26), and Michigan (+14).
The dashboard includes voter registration data from the 2018, 2020, and 2022 election cycles, allowing you to compare what we are currently seeing with past election cycles. It is updated twice a week and includes a wealth of demographic data including age, gender, race, and partisanship, as well as whether voters live in urban, suburban, or rural areas. The dashboard can help you answer a host of otherwise complex questions in a matter of minutes.
- How many women in rural communities registered as Democrats since the Dobbs decision?
- 271,072
- How has the gender gap changed in Senate battlegrounds pre and post Dobbs?
- +8 women in OH, +7 in AZ, and +3 in TX.
- How many people registered in your home state in May?
- We can tell you.
Now that you know what the dashboard is, I need to explain to you what it isn’t. It isn’t real time data. It's updated as we receive the information from various state and local election administrators. Some states release comprehensive data regularly, while others are not nearly as consistent. We pair the data we have with other public and commercial data to form the most complete picture of what the electorate looks like. While we can learn a lot from this data, we only know about people registering to vote, not whether or not they will actually show up and cast their ballot.
We’re really excited for you to explore the tool and develop your own analysis. If you have questions, I’d like to invite you to a zoom on Monday, September 26 at 12 p.m. where I’ll give a presentation on the tool and take your questions. You can RSVP here.
While this is now public, we at TargetSmart will continue to analyze the data as it rolls in, and we hope you will follow along @TBonier and @TargetSmart as we do!
Sincerely,
Tom
CEO, TargetSmart